Why We Are Excited About Canada's 2016 Census
Charles Thrift explains why our Knowledge program shares Canadians' enthusiasm for the 2016 Census.
A lot has been written about the 2016 census.
I've seen articles about the importance of the census data for all manner of things; the Twitterverse has exploded with selfies taken with census forms; and my Facebook feed is full of people proclaiming their support of evidence-based decision-making. In fact, Statistics Canada's census webpage crashed due to higher-than-expected traffic (it seems many Canadians were keen to fill in their forms right away. Don’t worry—I got mine in before it crashed…!). For those interested in learning more about this year's census, Statistics Canada's blog post about the 2016 census is quite good and discusses some of the changes from previous years (e.g., use of administrative data for income).
Here at IISD’s Knowledge program, we share the same census excitement described above, but for us it takes on a special significance, given our interest in the accessibility and interpretability of that data for decision making. There are some exciting things coming with this census that should (hopefully) lead to broader use by Canadians.
Our work has taught us that many in the community are very interested in using data, but don't necessarily know how to find and interpret it. It is partly for this reason that we partnered with the United Way of Winnipeg to develop our Peg project. Without good data, how can we know if our community is going in the right direction?
To improve the accessibility of this vital data regarding Winnipeg's social and environmental health, we use appealing ways of visualizing data, simple messaging and an interactive website where people can look at the data for different geographies and thematic focuses. We also maintain a smaller dataset to focus on those issues that matter most to Winnipeggers. Peg makes good use of census data to track educational attainment, people's transportation choices, the condition of housing and how many people are living on a low income. We also use census income data to see how issues in the community affect, or are affected by, income. In one way or another, the census informs most of our indicators.
Canadians' enthusiasm for completing the 2016 census has us hoping that they will share the same interest in using the results. With such a high percentage of the population completing the questionnaire, the results will be highly accurate. So, will Statistics Canada move forward in trying to make this valuable data as usable as possible, as we have focussed on doing in the Peg project, to all Canadians?
Statistics Canada has a very different mandate from Peg, but they share the objective of improving decision making via improved data/evidence. Statistics Canada "encourages the downloading and reuse of its data," but much of the data you'll find on the Statistics Canada website are in tables and reports. This is great for those of us nerds who are keen to work with the raw data, but a little less appealing to many. The website is often difficult to navigate, and it can be hard to find what you're looking for. Even so, there are a couple of interesting changes that have caught our eye: their new infographics and the Census Program Data Viewer. Both make use of data visualization to help us see patterns easily.
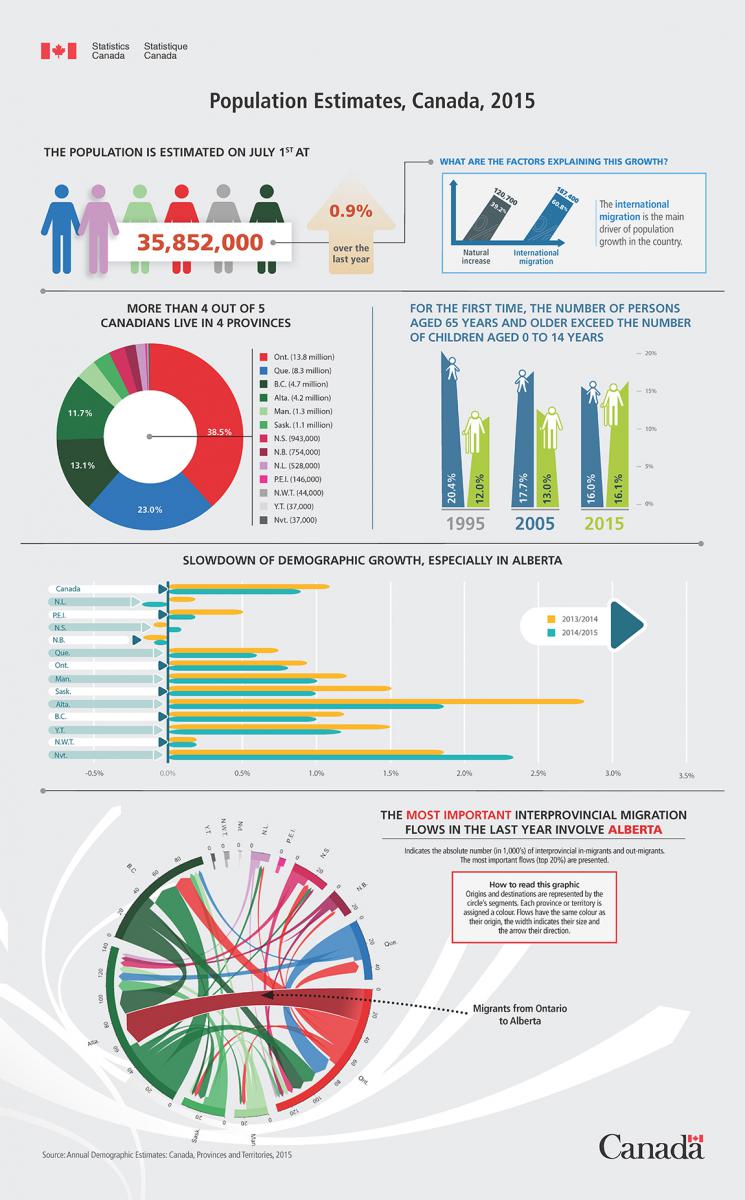
Infographics are helpful for quickly communicating key messages. Statistics Canada has been producing these for a couple of years now, but it will be nice to see them for the census data.
Statistics Canada is also building a new Census Program Data Viewer, which should make accessing and understanding the trends much easier. It has yet to be developed, but it should take the form of an interactive dashboard, with the ability to map, show bar charts and compare parts of the country. It sounds like it might be similar to what the U.S. Census Bureau uses or what is produced by InstantAtlas.
Statistics Canada is definitely moving in the right direction. As we strive to complete our census forms, let's not lose our enthusiasm after we click 'submit.' It's equally important for us to look at the results, in a format that we can all understand, as it is only through access to data that we can clearly see how well our country is doing, and what decision-makers need to do to improve life for us all.

Source: Statistics Canada, Infographic: Population estimates, Canada, 2015. 2015. Reproduced and distributed on an "as is" basis with the permission of Statistics Canada
You might also be interested in
Voluntary Local Reviews of Progress on the Sustainable Development Goals
A practical guide and resource list to help Canadian communities report on local progress toward the Sustainable Development Goals.
Report highlights inequities in Winnipeg neighbourhoods
A new 98-page report highlights some of the inequities well-known by Winnipeggers when it comes to the suburban-downtown divide. A Voluntary Local Review of Winnipeg was published recently and submitted to the United Nations by United Way Winnipeg and the International Institute for Sustainable Development. The report is one of the first of its kind In Canada — Kelowna, B.C., was the first in the country to submit the report — and shares Winnipeg’s progress towards localizing sustainable development goals or "SDGs."
2019 Our City: A Peg Report on Winnipeg and the Sustainable Development Goals
The Peg report 2019 Our City is a window into how Winnipeg is progressing and where we need to focus more energy to move toward targets set by the United Nations’ Sustainable Development Goals (SDGs).
2018 Our City: A Peg Report on Sustainability
Winnipeg is changing. Winnipeg has always been changing. The fourth edition of Our City, A Peg Report looks at Winnipeg through the lens of the three pillars of sustainability and integrates the Sustainable Development Goals.
