Insight

Contract Farming: Challenges and a new tool for success

IISD and FAO have developed a Model Agreement for Responsible Contract Farming to help farmers and responsible buyers address the shortcomings of contract farming.

November 28, 2018

“Sometimes you’re desperate for inputs, so you just sign on the dotted line…”

(Francais suivre)

These are the words of a young woman farmer growing tobacco under a contract farming scheme in Zimbabwe.

Contract farming is an agreement between a farmer and a buyer, often an agribusiness, to grow produce with set terms and conditions for things like price, quantity, quality and inputs. The young farmer was speaking at an event hosted by IISD, the Food and Agriculture Organization (FAO) and the Sam Moyo Africa Institute of Agrarian Studies in Harare this month. For two days, we brought together young farmers, agribusinesses, producer organizations, and civil society and international organizations to discuss the opportunities and challenges posed by contract farming.
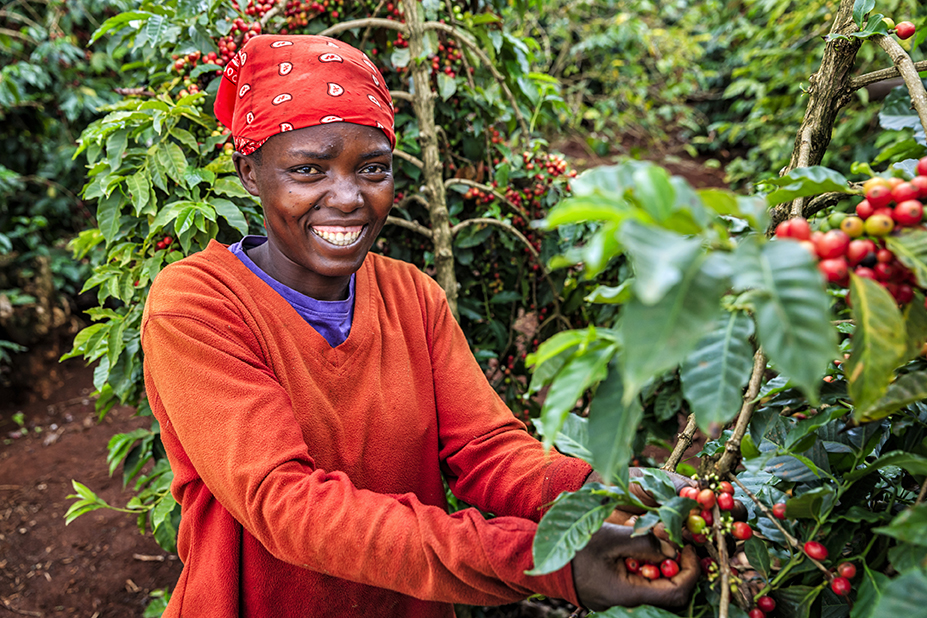
Coffee farmer

This diverse group grappled with questions like: Is contract farming inclusive? How can the power imbalances between farmers and agribusiness be addressed? Can contract farming help address the agricultural investment gap? Farmers shared their experiences in contract farming schemes and highlighted some of the key challenges, including:

  • They aren’t given enough time to study the contracts, which use confusing legal jargon.
  • Sometimes they aren’t given a written contract at all.
  • Contracts only give rights to buyers and obligations to farmers.  
  • Buyers delay in giving promised inputs like seeds or give inputs that are low quality.
  • Ultimately, the quality of the produce is determined by the buyer, and they can manipulate this to drive down prices.

In the context of these discussions, we shared a new tool to help farmers and responsible buyers to address these challenges: the Model Agreement for Responsible Contract Farming developed by IISD and the FAO.

The Model Agreement is a simple and practical legal tool to address power asymmetries, create more equitable and sustainable business relationships and support a transparent business environment for contract farming schemes. It provides simple, customizable template provisions, which can be adapted by the parties to suit the commodity, context and parties’ specific needs.

The farmers and buyers in Harare recognized that the Model Agreement isn’t a silver bullet to address all the challenges of contract farming. But it is a practical tool to help contract farming make a positive contribution to responsible investment in agriculture, support rural livelihoods and connect farmers to markets on fairer terms.

You can access the generic template online, as well as templates for coffee and tomatoes to show how customization can be done for different commodities.

Governments, buyers and farmers’ organizations looking to establish new contract farming schemes or enhance the fairness, transparency and sustainability of existing ones may be interested using in the Model Agreement. For advice on using or adapting the Model Agreement, please contact carin.smaller@iisd.org and sarah.brewin@iisd.net.

***

L'agriculture contractuelle: ses défis et un nouvel outil pour y remédier  

“ Parfois, tu as tellement  besoin d’intrants, alors tu te contentes de signer sur la ligne pointillée… »

Ce sont les mots d'une jeune cultivatrice de tabac du Zimbabwe participant à un projet d’agriculture contractuelle.

L'agriculture contractuelle est un accord entre un agriculteur et un acheteur, souvent une agroentreprise par lequel l’exploitant agricole s’engage à cultiver des produits selon certaines modalités portant notamment sur  le prix, la quantité, la qualité et les intrants.

La jeune cultivatrice a pris la parole lors d'un événement organisé ce mois-ci  à Harare par IISD, l'Organisation des Nations Unies pour l'alimentation et l'agriculture (FAO) et l'Institut d'études agraires Sam Moyo Afrique.. Pendant deux jours, nous avons réuni de jeunes agriculteurs, des agroentrepreneurs, des organisations de producteurs, la société civile et des organisations internationales pour discuter des opportunités et des défis posés par l’agriculture contractuelle.

Tomato farmer

Ce groupe hétérogène s’est penché sur les questions telles que: l’agriculture contractuelle est-elle inclusive? Comment remédier aux déséquilibres de pouvoir entre agriculteurs et agroentreprises? L'agriculture contractuelle peut-elle contribuer à combler le déficit d'investissement agricole? Les agriculteurs ont partagé leurs expériences en matière d'agriculture contractuelle et ont décrit certains des principaux défis rencontrés:

  • On ne leur accorde pas suffisamment de temps pour étudier le contrat dont le jargon juridique est déroutant.
  • Parfois, ils ne reçoivent aucun contrat écrit.
  • Les contrats donnent des droits qu’aux acheteurs et des obligations aux agriculteurs.
  • Les acheteurs tardent à fournir les intrants promis tels que des semences ou donne des intrants de qualité médiocre.
  • A la fin, la qualité du produit est déterminée par le seul acheteur qui peut le remettre en cause pour faire baisser les prix.

Dans le cadre de ces discussions, nous avons partagé un nouvel instrument pour aider les agriculteurs et les acheteurs responsables à relever ces défis: le Modèle d’accord pour une agriculture contractuelle responsable développé par IISD et la FAO.

Le modèle d'accord est un outil juridique simple et pratique permettant de remédier aux asymétries de pouvoir, de créer des relations commerciales plus équitables et durables et d’assurer un environnement commercial transparent pour les systèmes d'agriculture contractuelle. Il fournit des de modèle de dispositions simples et personnalisables, qui peuvent être adaptées par les parties en fonction du produit, du contexte et des besoins spécifiques des parties.

A Harare, les agriculteurs et les acheteurs ont reconnu que le modèle d’accord n’est pas une solution miracle pour relever tous les défis qui se posent à l’agriculture contractuelle. Mais il s’agit d’un outil pratique pour aider l’agriculture contractuelle à contribuer de manière positive à des investissements responsables dans l’agriculture, à soutenir les moyens de subsistance en milieu rural et à favoriser l’accès des agriculteurs aux marchés et ce des conditions plus équitables.  

Vous pouvez accéder en ligne au modèle générique, ainsi qu'aux modèles pour le café et les tomates qui vous montrent comment le modèle peut être adapté à différents produits.

Les gouvernements, les acheteurs et les organisations d’agriculteurs qui souhaitent mettre en place de nouveaux systèmes d’agriculture contractuelle ou renforcer l’équité, la transparence et la durabilité des systèmes existants peuvent être intéressés par le modèle d’accord. Pour obtenir des conseils sur l’utilisation ou l’adaptation du modèle d’accord, veuillez contacter carin.smaller@iisd.org et sarah.brewin@iisd.net.
Insight

Ten Years of G20 Summits: Hopes and failures

Does the G20 have anything to offer in a world of conflict and confusion?

November 27, 2018

As the G20 opens in Buenos Aires, most commentators expect it will be overshadowed by the meeting between U.S. President Trump and China President Xi and the question of whether there will be a full-blown trade war.

This view is superficial. A more relevant question is whether this forum, which played a key role in saving the global economy from a depression after the financial crisis of 2007–2008, has anything to offer in a world of conflict and confusion.

To understand the G20—its dynamics, its potential and its limitations—it is useful to imagine a schematic with two axes: one horizontal and one vertical.

G20 Hamburg
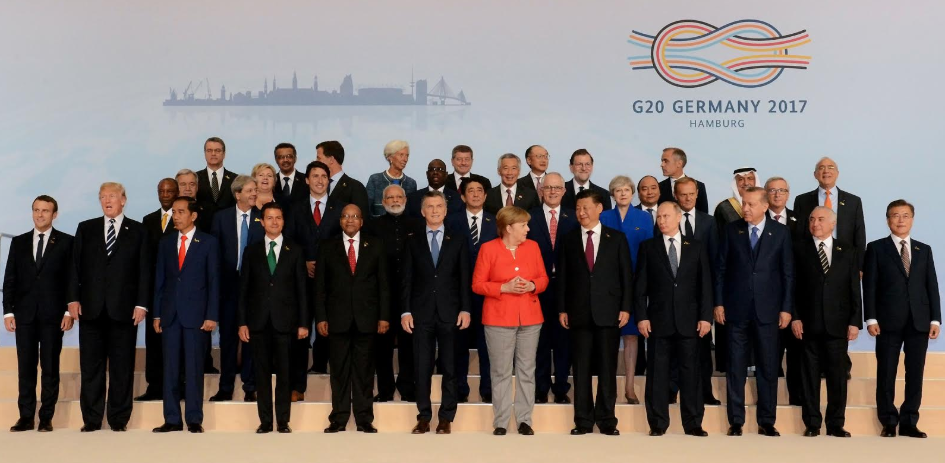
World leaders in Hamburg, Germany for the 2017 G20 meeting (Source: G20)

The horizontal axis can be thought of as dividing the interests of the elite—across all G20 countries—from the interests of the rest, of the 99 per cent, the workers and the poor. You could also describe this as dividing the interests of capital from the interests of labour. So think above and below, the haves and have-less or have-nots.

The vertical axis can be thought of as dividing the interests of different countries and country groupings. So think the G7 versus the BRICS, or United States versus China.

Let me describe how the G20 can be understood along these axes.

The horizontal axis of class

The very existence of the G20 as a presidential- and prime minister-level forum—and its one singular achievement—was to respond to the financial crisis at a scale that could prevent the global economy from falling into a depression.  It did so through a coordinated rescue of the main private sector financial actors and through a public fiscal and monetary stimulus, with the biggest contributions coming from China and the United States.

The initial rescue benefitted the G20 economies broadly, beyond the financial sector. But very quickly the focus turned to the interests of capital—bond holders in particular—as reflected in the 2010 decision at the Toronto summit to call for fiscal consolidation. Even though working people and the poor were still suffering the effects of the crisis in terms of unemployment, lost income and stagnant or declining wages, the G20 agreed to “hit the brakes.”

Over the next few years, several countries and the International Labour Organization (ILO) insisted the G20 needed to address continuing unemployment and rising inequality. They called on the group to act on both the quality and quantity of jobs, wages and the declining labour share. A labour ministers' track was established in 2010, followed by the creation of an employment working group. In 2015, a subgroup on labour income share was created—on a proposal from Argentina with support from host Turkey and several other countries.

However, the G20 never moved to adopt the policies recommended by these working groups, only paying lip service to the need for “more and better jobs.”

When the backlash against the effects of globalization started to manifest politically in 2016, beginning with Brexit, then the election of Trump and so on, the G20 could easily be seen as part of the problem: an instrument of the international elite. In that sense, the G20 missed important opportunities to help coordinate some redistribution from the winners of globalization to the losers, some coordinated increase in wages, that could have mitigated the harsh effects of the crisis on working people or at least slowed the decline in the share of the global and national economies going to working people and the increased share going to wealthy investors.

That is a brief synopsis of the G20 performance along the horizontal axis.

The vertical axis: The alignment of countries and blocs.

This is where we are seeing a fundamental shift in alignment since the election of Trump and other recent developments. Before that, there was a tacit assumption the shared interests of the G20 outweighed the competing or diverging interests, at least enough to make it a useful forum for addressing some critical challenges.  Certainly that was the case during the 2008–2009 rescue of the global economy. 

Under a tenuous assumption of shared interests, the group would try to converge on issues that were in dispute: for example, trade, development and action to address climate change. This was also the case with labour, inequality and economic fairness. On the latter questions a few countries took the lead, along with the ILO: Argentina, Brazil, France, South Africa, sometimes the United States under Obama and sometimes Turkey. Of course, the possible coalition changed when participating governments shifted from centre-left to centre-right governments. But the lack of a broader consensus meant on issues of labour, as well as trade, development and environment, the group agreed only to lowest-common-denominator statements and no new action.

Now, however, the United States under the Trump administration is pursuing an active containment strategy toward China, in both the economic and military spheres. And the United States, United Kingdom and some other countries are doing the same toward Russia. As a result, there is likely to be a more open development of blocs within the G20. The United States is less likely to push for G20 collaboration on trade or other economic issues.  China and Russia are more likely to coordinate their positions. As for the other countries, Brazil under a new president may align more with the United States than with the BRICS during the coming period, for example. 

In this new geostrategic environment, it is likely the G20 will accomplish little in the immediate future, under the current Argentine government’s presidency or under Japanese and Saudi Arabian presidencies in 2019 and 2020.  

A bleak outlook heading into Buenos Aires

The G20 was designated as the “premier forum” for international economic coordination in the face of the rapid global integration of the 1990s, rapid growth of China and the other BRICS in the 2000s and the clear inability of the G7 to continue to dominate and resolve crises in their own interests. The assumption until very recently was that expansion to the broader group of large economies would bring more players to the table but still with a shared interest in the stability of the global economy. 

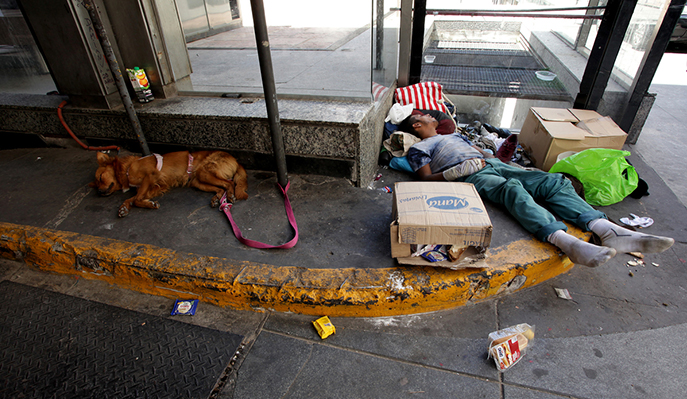
A man and his dog sleep on the streets of Buenos Aires.

For some progressives, there was the hope this more representative grouping of countries could play a moderating role in global economic relations. It seemed it could at least bring more attention to the needs of developing countries—and the needs of the losers from globalization in all countries. However, this hope for some improvement or redistribution along the horizontal axis of class and inequality has been continually dashed.

And now attention will shift to the vertical axis. The G20 for the next few years may be no more than another reflection of a world on the brink of dividing into blocs.

Insight details

Insight

What's Stalling the G20's Move to Clean Energy?

Next year will mark a decade since G20 leaders met in Pittsburgh and promised to identify and eliminate subsidies to fossil fuels. In that time, trillions of dollars in government budgets have been spent to subsidize fossil fuel production and consumption.

November 27, 2018

Momentum toward the transition to clean and low-carbon energy pathways is growing, in G20 countries and beyond.

Many G20 countries have led world markets in renewable energy investments, notably China, Mexico and Australia. Global investments in renewable energy add up to more than USD 2 trillion, according to a new report from UN Environment and the Frankfurt Business School.

A record 157 gigawatts of renewable power—classified by the report as wind, solar, biomass and waste-to-energy, geothermal, marine and small hydro—were commissioned in the world’s electricity sector in 2017.

This transition matters in addressing climate change: just over 12 per cent of the world’s electricity came from renewables last year, avoiding or displacing an estimated 1.8 gigatonnes of carbon dioxide (C02) emissions.

Last year, overall investment in renewable energy grew by roughly 2 per cent, to nearly USD 280 billion. As the costs of renewable energies decrease rapidly, what appears to be modest growth is in fact a strong expansion of renewable generating capacity. These investment trends mean that renewable energy markets are growing much faster than conventional fossil fuels, by a rate of roughly two-to-one in overall investments.

There are various drivers behind this increase, led by a drop in the price of solar technology, which is now the lowest-cost form of power generation across most of the world. Increased exploitation of other clean energy solutions such as geo-thermal and bioenergy at large scale have also been instrumental.

In at least two fundamental ways, the G20 provided the underlying conditions for this accelerated growth:

First, the G20 Finance and Central Bank Deputies adopted a proposal to launch a G20 Green Finance Study Group (GFSG). The remit of that group is to “identify institutional and market barriers to green finance” and identify options to accelerate green investments.

A central part of this mandate is environmental risk in general, and climate risk in particular. The GFSG committed to identify, and help quantify, different kinds of environmental risk. Since their report was adopted, China–which made up roughly 45 per cent of all global renewable energy investments in 2017—has begun to implement the most ambitious, systematic approach to green finance, encompassing not only green bonds (for which it is a world leader) but also insurance, stock markets and other pillars of financial services.

Second, the June 2017 report of the Financial Stability Board (FSB) Task Force on Climate-related Financial Disclosures recommended that, because climate risk poses a material risk to financial markets in G20 countries, preparers of climate-related financial disclosures should provide such disclosures in their mainstream (public) annual financial filings.

Task Force on Climate-Related Disclosure
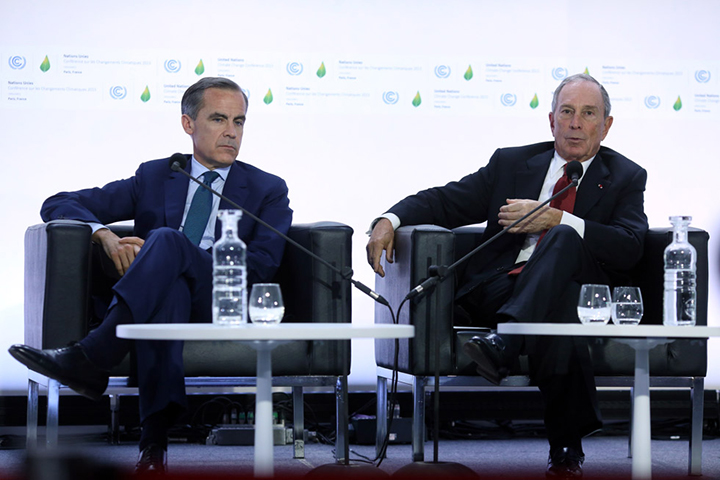
Mark Carney (L) Chair of the Financial Stability Board and Governor of the Bank of England and Michael Bloomberg (R) Chair of the TCFD (Source: FSB)

Some of the growing momentum that stemmed from the release of the FSB task force report was on display last December at the One Planet Summit hosted by French President Emmanuel Macron. There, 225 investors–including many of the world’s biggest asset managers—pledged to put pressure on 100 of the most carbon-intensive companies–from oil and gas to aviation and consumer products—which together are responsible for nearly 85 per cent of global greenhouse gas emissions.

A list of the top greenhouse gas emitters was shared at the Paris conference, meaning carbon polluting companies are being "named and shamed" and squeezed on the one side from central bank regulators and on the other by big asset companies like Blackrock, Vanguard and others.

While these two G20 efforts continue to push markets towards low-carbon pathways, 2017 also reminded us of the unfinished agenda in tackling fossil fuel subsidies and of the inertia that makes moving away from fossil fuels difficult.

Next year will mark a decade since G20 leaders met in Pittsburgh and promised to identify and eliminate subsidies to fossil fuels. In that time, trillions of dollars in government budgets have been spent to subsidize fossil fuel production and consumption.

The continued pricing distortions that subsidies exert within energy markets are counterproductive. They not only weaken the fiscal position of governments by increasing deficits and debt, they also slow the energy transformation and thus delay climate action as well as the multiple benefits of the shift to clean energy.

Those benefits include not only improvements in public finance, but also improved public health from reduced air pollution, higher energy security and reduced total cost of energy supply, innovation and a renewable of capital stock, business and employment growth, rural development, and improved balances of trade and payment, notably countries that can reduce their imports of fossil energy commodities and products.

But realizing these benefits needs governments across the G20 to plan and implement an energy transition. While a lack of pricing of local and global air pollution has hampered the ability of markets and investors to pick the clean options, a fear of economic shock and job losses in communities with strong reliance on fossil fuels hampers governments.

The recent Berlin Energy Transition Dialogue, the fourth now held, is one of a series of events and initiatives that have highlighted the fact that transition can be successful and that communities do not need to be left behind. Exchanging experiences and lessons learned—both good and bad—can only help the G20. Common approaches and a commitment would be even better.

This article first appeared on the G20 Portal on November 25, 2018.

Insight

The End of Coal? What to Watch for at the Upcoming UN Climate Conference (COP24)

While COP24 was always intended to be a "technical" conference—with parties focused on finalizing the details required to operationalize the Paris Agreement—there is potential for a strong political element to the discussion.

November 27, 2018

Thousands of people will soon arrive in Katowice—a city of 300,000 in southern Poland—for the latest round of negotiations and discussions at the UN Climate Conference (also known as the 24th UNFCCC Conference of Parties, or COP24).

Each year the conference has an underlying theme, and this year the focus is "Just Transition," used to describe an approach to economic and environmental policies in the transition to a low-carbon economy that minimizes impact on workers and communities.

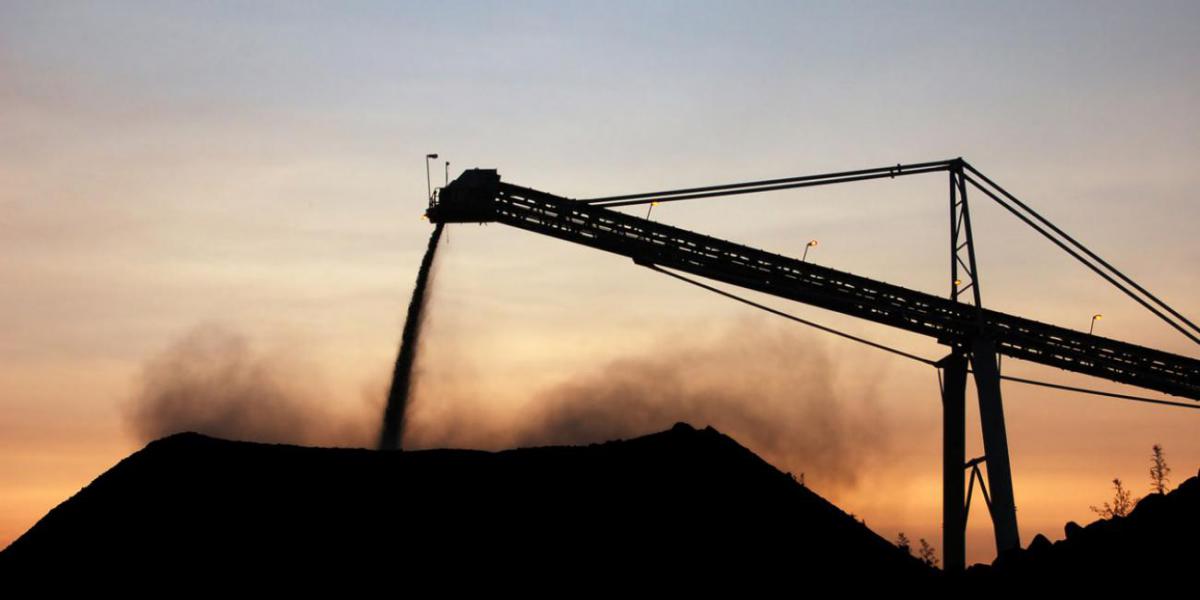
The theme is especially fitting given that Poland is one of Europe’s largest exporters of coal, and Katowice lies at the heart of Poland’s rust belt. Coal sector workers in Poland generally, and in Katowice particularly, are poised to face a strong impact from a global shift away from coal. The area has gone from having 14 active coal mines in the 1980s to two today.

Katowice coal

Over 72 million tonnes of coal were produced at mines in Poland in 2015. Poland is also the 10th largest coal consumer in the world and second largest in the EU after Germany. With renewables growing around the world and particularly in Europe, but Poland still heavily invested in a long-term commitment to coal, the focus on a just transition for coal workers is obvious, especially as Poland is also pressured by EU climate change policies, and in turn the EU has committed major assets (USD 1.9 billion) to assist Poland with mine closures.

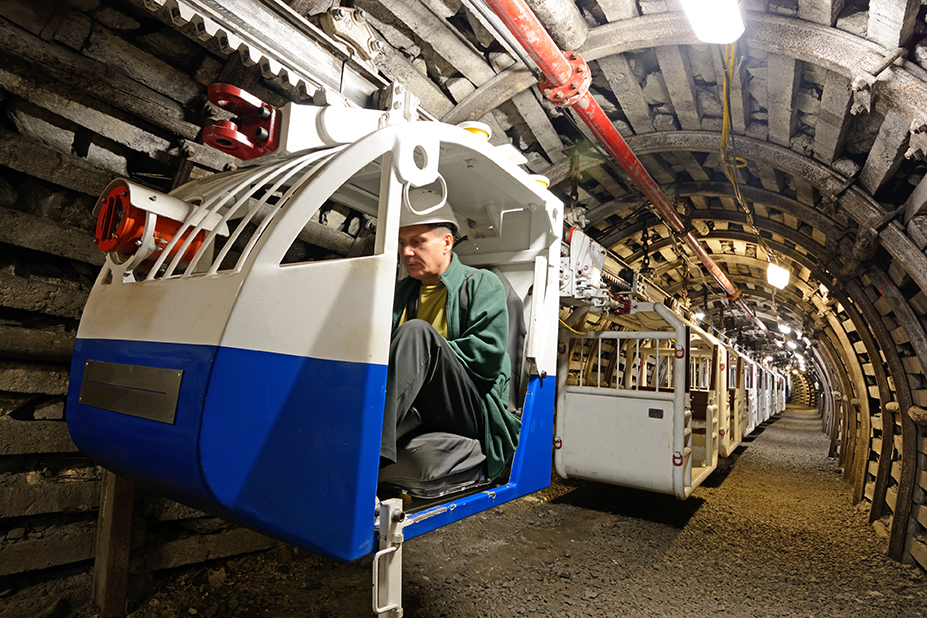
Katowice mining

COP24 could also mark the moment when the "end of coal" discussion hit the forefront. Beyond the link between Poland’s public focus on Just Transition and its behind-the-scenes pressures on its coal future, there is bound to be vocal activity from the Powering Past Coal Alliance (PPCA), which launched last year at the COP in Bonn and has now grown to include 28 national government members, 19 sub-national governments (including seven U.S. states), and 28 businesses. A number of official side events also focus on the phase-out of coal, or on the phase-out of fossil fuels more broadly. Canada, as a founding member of the PPCA, will feature prominently though several planned speaking engagements for Catherine McKenna, Minister of Environment and Climate Change.

There is also likely to be a repeat of the circus-like atmosphere that happened in Bonn, when protestors packed the audience to disrupt a U.S. government-sponsored side event focused on the country’s commitment to clean coal. This year, the U.S. has an official side event ambiguously titled: “U.S. Innovative Technologies Spur Economic Dynamism,” which is almost certain to draw a lot of attention for the wrong reasons. Several American states are also likely to have prominent speaking events on climate change and clean energy, led by Jerry Brown, California’s outgoing governor, who has been a vocal critic of President Trump.

Meanwhile, the focus of the formal negotiations will be the adoption of the Paris Agreement Work Programme (PAWP). This framework will include not only how (and how often) countries will continue to submit nationally determined contributions (NDCs), which embody national efforts to reduce national emissions and adapt to the impacts of climate change, but also the transparency and accountability framework and convening a global stock-take. Several countries are concerned about the state of negotiations after a special session in Bangkok in September did not result in an outcome being made any clearer. There is a lot of uncertainty going into Katowice on the topic of greenhouse gas mitigation.

Uneven and inefficient progress clouded the prior sessions in Bonn and Bangkok leading to concerns Katowice will be unable to deliver the PAWP as expected, especially as compilation text grew to over 300 pages in Bangkok.  Coming out of Bangkok there was little clarity on how resolution will emerge from the current tangled and complicated process, with one assessment noting “parties have yet to even decide what they need to decide.”

As for Canada specifically, the PPCA and the Pan-Canadian Framework on Clean Growth and Climate Change will be the focus areas. Canada will attract questions on its approach to climate change (specifically its carbon pricing plan), and its ability to achieve its NDC when it presents in a multilateral assessment session at the COP.  The Canadian government is expected to speak frequently on the coal phase-out, and it is likely that the outcomes from the Task Force on Just Transition for Canadian Coal Power Workers and Communities will be teased as the report is expected by the end of 2018. At the same time, Canadian environmental groups will be drawing attention to the purchase of the Trans-Mountain Pipeline Expansion, which has been a controversial decision, with questions on how it will impact NDC achievement.

There are high expectations for COP24, particularly on the PAWP. Doubts are starting to creep in, however, that the goalposts may be moved to a later date, as often occurs in this process. It will be critical to ensure a deadlock is avoided and the event at least makes progress toward the ultimate goal. Entering COP24 with a 300-page text with many unknowns is a concern. Leaving COP24 in the same state, or moving backwards, would be unacceptable.

Insight

To Think Local and Act Local You Need Local Data

Data is no exception to the trend of localizing our consumption, charitable giving and development efforts.

November 27, 2018

In recent years, there has been a renewed effort to focus our consumption, charity and development efforts locally.

We’re encouraged to buy, eat and even travel close to home to reduce our ecological footprints. Business groups run Buy Local campaigns in nearly every urban centre. As a counter reaction to our increasingly digital world, leaders of all stripes—political, religious, educational, environmental—have suggested we strengthen our connection to and understanding of our sense of place.

Data is no exception to this trend.

City data

There are increasing calls for urban and rural communities to access and use local-level data for informed decision making, planning, accountability and mobilization. Across Canada, civil society organizations such as the National Climate League and their regional climate hubs call for greater access to local-level environmental data. Similarly, collaborative efforts to localize the Sustainable Development Goals (SDGs), such as those from organizations involved in Alliance 2030, amplify the call for localized data to track progress on the SDGs.

Winnipeggers have taken the local data movement to heart and lead the way on several fronts, sharing their know-how with the rest of Canada. Winnipeg is home to the Prairie Climate Centre (PCC), and the Canadian Climate Atlas. Based at the University of Winnipeg, the PCC shares data for key climate indicators, developing climate data reports for numerous Canadian cities. The PCC makes an impact through knowledge mobilization, sharing documentary-style videos and articles about communities taking action to reduce their carbon emissions and improve community resilience to climate change.

The Climate Reality Project Canada's (CRPC's) Climate Hub in Winnipeg digs deeper into climate trends and impacts data, providing access to climate-related data at the city level. This work has made an impact by involving citizens to advocate for access to environmental data. The Winnipeg-based hub is part of a larger effort by citizen groups across Canada to advocate for, track and compare local-level environmental data.

“Currently, some of the most exciting and effective climate action is taking place at the local level. Having reliable, consistent measurements that we can share is a really useful way to increase visibility of what our neighbours are doing. And hopefully, this will be a gateway to greater collaboration across the country." - Curt Hull, Climate Leader, Climate Reality Project Canada Board Member

The Peg Community Indicator System (CIS), run by the International Institute for Sustainable Development (IISD) and the United Way Winnipeg, curates over 60 indicators to measure community well-being and sustainability related to the seven themes of the built and natural environments, health, basic needs, economy, governance and social vitality and education. Together, this data forms a basis for community priority setting and decision making. Peg’s recent efforts to connect their indicators to the SDGs further acts to inspire action across the city. Peg’s data has helped inform local government officials, educate youth on data literacy, set strategies for philanthropic organizations and stimulated conversations and storytelling on topics that matter to Winnipeggers.

“The indicators presented in Peg were instrumental to the development of the For Every Family Initiative—a project aimed to enhance the well-being of children and families in our community by enhancing the services of family resource centres. The data in Peg provided an evidence-based foundation to this initiative and was key in developing the case for support for our partners, including the Province of Manitoba, The Winnipeg Foundation, and numerous other foundations and philanthropists. By analyzing the data related to readiness to learn, children in care, and household income, we were able to identify how to best focus our energies in order to have the greatest possible impact in our community.” - Kathy Knudsen, Vice President, Community Impact – United Way Winnipeg

Peg is also the flagship CIS on IISD’s Tracking-Progress platform; an easily replicable on-line tool enabling communities across the country to determine and measure their own indicators of sustainability.

The Manitoba Collaborative Data Portal (MbCDP) is a key resource for spatial data and related resources aimed to promote informed discussion and decision making through access to data. The portal shares data on topics related to community health, transportation and housing. The MbCDP and the Winnipeg Data Consortium members lead the way in community data validation through their work to draw the consensus, understanding and shared knowledge needed to strengthen the local data landscape.

Together with other academic, government and civil society institutions, these four initiatives form part of a rich community data landscape that helps to inform, improve and support local efforts to shape the city into a more sustainable and equitable place.

This article first appeared on the Community Climate Hub on November 26, 2018.

Insight

Citizen Science Fills Critical Gap in Monitoring Freshwater Resources

Most of us lack baseline data about our ecosystems, which makes it difficult to recognize changes and detect early warning signs. Enter citizen science.

November 19, 2018

The recent unnerving report by the Intergovernmental Panel on Climate Change (IPCC) showed that time is running out to avoid the rapid, oncoming and serious consequences of global warming.

While the jury is still out on whether our efforts can keep warming below 1.5 C, what is clear is that every scientific report, database, case study and anecdote about our warming planet has provided evidence to encourage us to take action. But across the world, most of us lack baseline data about our ecosystems, which makes it difficult to recognize changes and detect early warning signs.

Citizen science

Collecting data while engaging citizens

According to a recent survey commissioned by the RBC Foundation, Canadians are proud of our freshwater lakes and rivers: 45 per cent say it is our most important natural resource. Canada holds nearly 20 per cent of the planet’s freshwater, but we know very little about our lakes and rivers, which makes it difficult to determine how to best protect our water.

In fact, WWF-Canada recently concluded that 14 of Canada’s 25 major watersheds are insufficiently monitored to assess the overall health of our ecosystem. This needs to change.

From our office in Winnipeg, we have been gazing longingly at a new initiative called Atlantic DataStream. It’s a platform for community groups, government officials and citizen scientists to archive and share their measurements of water quality from lakes and streams scattered across the four Atlantic provinces. Citizen science engages local volunteers to collect data about their surrounding environment in the name of science.

Atlantic DataStream

This platform helps communities take action in their own backyards, by housing data and most notably, opening it to the public, with features to explore water trends (even without experience combing through file servers or using complicated plotting software).

Atlantic DataStream has even gone a step further by integrating blockchain technology into its platform to create trust between those collecting data and those using it. This technology encodes a fingerprint into each dataset upon uploading, allowing citizens to track use of their data and users to ensure data has not been altered. This feature, along with other technological advancements, encourages governments to use citizen science research to fill data gaps and inform decision-making.

This is a unique and collaborative initiative to reduce data deficiency and engage citizens. Holistic, accessible and understandable data informs citizens and decision makers, ultimately leading to smart decisions for a better planet.

We must see more initiatives like this that bring scientists and citizen scientists together to address data deficiency in the name of environmental protection across Canada. If communities in Atlantic Canada can come together to flag environmental issues and then harness their collective power to address them, then the rest of us need to take note.

The IPCC report resonated through our communities – grabbing headlines and sparking debates – because decades of modelling and centuries of observations allowed experts to address and project the future of the planet. It’s the fruit of massive, worldwide collaboration.

Unlike the climate in general, we don’t know or share enough information about our freshwater to project its future.

Projects like the Atlantic DataStream do not just demystify science; they open it up to local communities to create and share essential data about our water, so that we can all make informed decisions and safeguard a sustainable future.

This article first appeared in The ChronicleHerald on November 14, 2018.

Insight

Not a Case of Either/Or: How government and mines in Zambia can save money through energy efficiency

For years, Zambia’s large hydroelectric dams were able to meet the power needs of its mines, but facing rising electricity demands the country opted to increase generation using coal, diesel and heavy fuel oil.

November 16, 2018

Copper mining has played a decisive role in the economic history of Zambia for more than a century.

Beginning in the 1920s, American and South African mining companies scaled up production and established the Luanshya, Mufulira, Rhokana and Nchanga mines. By the 1960s, Zambia was a major player, producing 12 per cent of the world’s copper. The mining sector is by far the most important industry in Zambia: in 2012 it accounted for almost all foreign direct investment (86 per cent) and export earnings (80 per cent). One quarter of all government revenues and 10 per cent of GDP comes from mining, and it accounts for almost 2 per cent of all formal employment.

Zambia mining

The scale of the mining industry means that it is by far the largest consumer of electricity. Over half of Zambia’s electricity is consumed in the country’s mining sector. For years, Zambia’s large hydroelectric dams were able to meet the needs of the mines, but rising electricity demand, reaching 11 TWh per year in 2017 up from 8.6 TWh in 2010, created a situation in which the country had to the either invest in additional generation or reduce demand.

Faced with this choice, Zambia opted to increase generation using coal, diesel and heavy fuel oil (HFO). This pressure saw the first major coal generator installed since independence. The 300 MW Maamba coal power station was commissioned in 2016 and now accounts for around 10 per cent of Zambian electricity generation. It is reported that a further 300 MW at the site is in development. Diesel and HFO power generators included 55 MW of HFO generators at Ndola installed between 2013 and 2017.

As demand rises, new coal generation could be developed, creating a transition away from today’s relatively clean hydro-generated electricity. The increasing share of coal and diesel makes electricity generation more expensive. This is especially the case during peak demand, as the merit order of the electricity system runs from cheap hydropower to increasingly expensive coal, diesel and HFO, as well as imports from the Southern African Power Pool. A marginal reduction in electricity demand at peak times tends to knock out the most expensive source of generation.

The mines pay low tariffs for electricity. However, this tariff is not thought to be sufficient to cover the costs of the national utility, ZESCO. In August, mining company tariffs were raised to USD 9.3 cents per kWh, but this is still not deemed enough to cover the cost. A much-delayed cost-of-service study was due to increase transparency and lay out the costs of electricity provision, indicating whether further hikes are needed to balance ZESCO’s books. Any gap between costs and revenues that creates losses at ZESCO must ultimately be bailed out by the government through subsidies or other mechanisms. This means that the government is effectively providing a subsidy to the mining industry for every unit of electricity it consumes.

The current uncertainty about electricity tariffs is creating a problem for the mining industry. It is difficult to make investment decisions in the absence of clear information on the costs of electricity going forward.

There is one solution that would help to address all these issues: If the mines increased energy efficiency, they would reduce their electricity bill and become less exposed to the price of electricity. The government would need to provide less power from the most expensive generators, since the most expensive generators tend to be the last to be dispatched, and ZESCO could move closer to cost recovery. Energy efficiency could be a win–win.

Research from the CUTS Lusaka, IISD and Gaia Consulting project team has shown that support for energy-efficiency investments could save money for the government, the mines and the electricity sector as a whole. The meetings were a part of an ongoing project on subsidy swaps to reduce fossil fuel subsidies and use savings to promote sustainable energy. A scheme to promote energy efficiency could be partially funded by savings from offsetting the effective electricity subsidy. We thought this was a brilliant idea—now we wanted to find out whether the mines thought so too.

In October 2018 our team of researchers visited the mines. In Kitwe, one of the major copper-producing regions of Zambia, we discussed with energy managers from the mines how energy efficiency can be promoted and were surprised by the level of enthusiasm. Mining company energy managers reported that they had already identified numerous potential projects that could reduce energy demand and improve efficiency. Some of these projects are already taking place. However, finding capital for larger projects remains a challenge. Providing low-cost loans or risk reduction measures could help these projects to succeed.

Another exciting potential area is self-generation. As electricity tariffs rise, solar energy becomes cost-competitive. With continuous electricity demand for activities like water pumping, there is a constant based load in the mines that could be met during daylight hours by solar photovoltaic generation. The combination of falling solar costs and rising electricity tariffs are making this increasingly attractive. Mining companies reported that they are already exploring the potential for self-generation.

There is an opportunity to create a system that rewards investments in efficiency and self-generation. This can solve two problems at the same time: it can incentivize mines to reduce their electricity consumption and it can make an increase in electricity prices to cost recovery levels easier. To accelerate this transition, a series of further carrots and sticks can be added. For example, tariffs for mining companies could be reduced if they have made energy-efficiency investments or conducted energy audits. A portion of the revenues from the increased tariff could also be recycled into a fund providing low-cost credit to energy-efficiency projects.

IISD, CUTS Lusaka and Gaia plan to publish detailed results from their consultations and hold further discussions on this issue.

Insight

What Do Bears and Smartphones Have in Common?

The challenge that electronics hibernation poses to the circular economy.

November 15, 2018

As the weather cools and the snow threatens to fall, bears, bats and hedgehogs snuggle their way into another season of winter hibernation.

And many of our old smartphones, believe it or not, are joining them.

Bears and electronics share a hibernation habit

Hibernation, as it pertains to smartphones and electronics, refers to the period when a phone or piece of technology is not recycled or thrown away, but is instead kept by its owner long after they have stopped using it. Unlike our furry friends, valuable electronics go into hibernation for years at a time, hidden away in desk drawers and closets, sometimes never to re-emerge.

While the retention of our dead phones keeps electronics out of landfills, thereby reducing e-waste, squirreling away electronics is a major barrier to mineral recycling and the overall aims of the circular economy.

Minerals like lithium and cobalt are both essential building blocks to smartphone batteries but are projected to experience significant supply shortages in the coming decade due to rapidly increasing demand from the makers of electric vehicles (EVs) and other green energy products, which also require these minerals for their battery components.

The price of cobalt, for example, increased by 180 per cent from 2015 to 2018 related to accelerating EV demand. According to Forbes Magazine, demand for cobalt is expected to grow at an annual rate of 11.6 per cent over the next decade. Similarly, in 2017 the demand for lithium increased by 13 per cent, and it is expected to more than double by 2024. Demand for lithium and cobalt is expected to outstrip supply by 2023 and 2025, respectively.

Further, notable conflict risks and human rights abuses have been found in the supply chains of these two minerals. Among these, incidents have been reported in the Democratic Republic of the Congo of child labour in cobalt supply chains, and public demonstrations and grievances have arisen surrounding land and water management in mining communities in the Lithium Triangle.

These supply chain issues—relating to both extraction shortages and failures in responsible sourcing best practices—pose a considerable risk to the contribution that the extraction and trade of either mineral can make to sustainable development in host communities and countries.

One way to stave off these supply shortages and conflict risks is to recycle the minerals and metals already in the system. This has been the subject of many conversations at the 2018 EU Raw Materials Week in Brussels, the theme of which was “Raw Materials for a Low-Carbon and Circular Economy.”

Mineral recycling has the potential to ease supply concerns by extracting and reusing minerals and metals from products already in our economy but currently discarded or unused. Further, the recycling of minerals has an ecological footprint 90 per cent smaller than that of primary mining.

This recycling can also be done with relatively low impacts on the overall energy efficiency of the battery. Many of the products tossed aside by their owners are put into drawers due to physical problems like cracks in the case or simply out of a desire for an upgrade. But their component parts are often far from the end of their useful life. A study by Brunel University collected used laptops and found that only four of the 148 batteries tested were unusable. In fact, most still retained about 89 per cent of their original capacity, making them ideal for recovery and recycling processes.

Mineral recycling rates, however, are low. A report by the United Nations University found that only 20 per cent of electronic waste from mobile phones and laptops were recovered. Another report by Friends of the Earth found that only 4–5 per cent of lithium-ion batteries in the EU were collected for recycling.

These low recycling rates are not due to a lack of technology. Apple’s recycling robot “Daisy” can recover approximately 770 kg of cobalt per 100,000 iPhones, or 96 per cent of the iPhone’s cobalt content.

The main barrier to mineral recycling, according to many experts, is the low rate of end-of-life collection. Christian Hagelüken, Director of EU Government Affairs at Umicore, said at the EU Raw Materials Week that “the pitfall for recycling is that most consumer products are not collected, or not properly collected.”

Instead, they sit in the bottom drawer of our desks gathering dust. Oftentimes, this period of hibernation long surpasses the amount of time the electronic was in use.

If promises of warm weather and honey won’t coerce these electronics out of their hiding places, what is to be done?

For one, awareness needs to be raised about the issue of empowering consumers and companies to take action and reverse low collection rates. At Raw Materials Week, Guy Ethier, Senior Vice President of Sustainability at Umicore, explained that, “as a consumer, we are part of this obligation.”

A study by the European Commission also found that enhancing collection systems and infrastructure, as well as increasing the lifespan of mobile phone use, would positively contribute to a circular economy for smartphones and other electronics.

We could all take a page out of the bear’s book when it comes to our old electronics. For the bear, spring offers the chance to refuel, re-energize and re-engage with the world around them. Our phones, laptops, and other electronics need to do the same. Getting these products out of hibernation and into action will be a key contribution to the sustainability of mineral supply chains and the circular economy.

Insight details

Insight

Forget GDP – for the 21st Century We Need a Modern Growth Measure

Our radar to track progress is far from satisfactory.

November 14, 2018

It is critically important that we monitor societal progress and design responsive policies to 21st-century challenges, such as climate change, the marginalization of more than a billion people, resource depletion and emerging pollution-driven health crises.

We need reliable metrics to know how we are performing on the yardsticks of our economy, sustainability and social harmony. Unfortunately, our radar to track progress is far from satisfactory. Countries still use a 20th-century metric to measure well-being: Gross Domestic Product (GDP).

Comprehensive Wealth

GDP provides measurements of output, income and expenditure quite well, and these are needed to understand and devise fiscal and monetary policies. But this measure flatly fails when it comes to well-being. Its founder, Simon Kuznets, cautioned half a century ago that it is useful mainly in tracking income. More recently, other economists suggest knowing change in per capita wealth of all types is key to monitoring sustainability.

Hence, there is growing international interest in a tool that still captures financial and produced capital, but also the skills in our workforce (human capital), the cohesion in our society (social capital) and the value of our environment (natural capital).

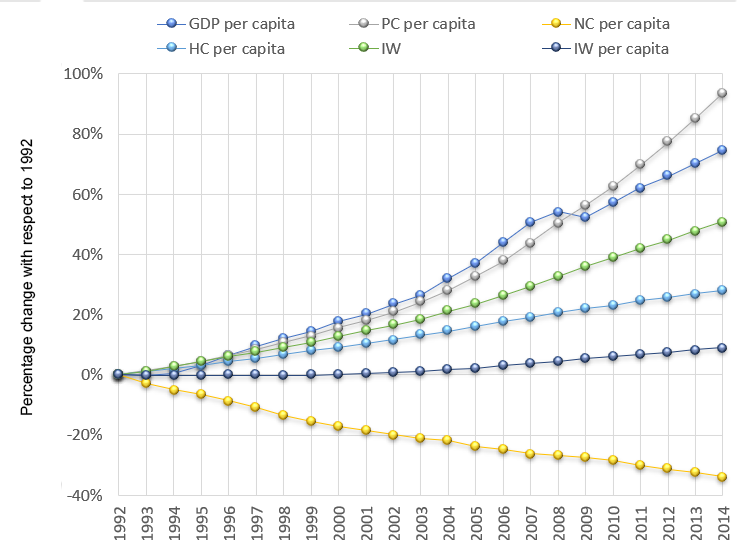
Work has advanced on some of these elements. The UN Environment-led Inclusive Wealth Index shows the aggregation through accounting and shadow pricing of produced capital, natural capital and human capital for 140 countries. The global growth rate of wealth tracked by this index is much lower than growth in GDP. In fact, the 2018 data suggests that natural capital declined for 140 countries for the period of 1992–2014.

Interestingly, many countries record GDP growth while they lose natural capital. One can see the trade-off among various types of capital, but the report clearly conveys that mixing income with wealth is bad economics and dangerous for sustainability measurement.

The index’s findings include strong recommendations to help reach global sustainability targets, including the UN Sustainable Development Goals. Closely tracking countries’ productive bases is key, as a declining asset base implies a non-sustainable trajectory. Many of the assets critical for maintaining productive bases are either not priced or are priced at much lower levels than they should be. This is especially true for natural capital and human capital assets. Natural capital assets such as forests and water bodies have only been valued for the products they provide for the market, such as timber and fish. However, these ecosystems offer a much larger suite of services, such as water purification, water regulation and habitat provisioning for species, among many others. These are clearly valuable services.

Natural Wealth
HC - Human Capital, PC - Produced Capital, IW - Inclusive Wealth, NC - Natural Capital

The Inclusive Wealth Index also helps policy-makers prepare to negotiate for reductions in greenhouse gases as well as for compensations accruing from climate change. Further, past reports have shown conclusively how countries can become unsustainable in absolute terms when population growth is factored into the computation. Understanding the impact population growth has on productive bases is a critical variable that leaders should factor into policy-making.

So analytic progress has been made, but there is still a need to bring all five elements of prosperity—financial, produced, natural, human and social capital—into one framework.

A new Canadian report does this.

Canada's Comprehensive Wealth project adds one number for evaluation and policy-making on top of GDP: a per capita sum of the five elements of prosperity. It draws on data from Statistics Canada—one of the finest statistical organizations in the world—which measures many elements of prosperity separately, to varying degrees of depth.

The report raises several red flags, most notably that Canadians’ comprehensive wealth only grew at an annual average rate of 0.2 per cent from 1980 to 2015. In contrast, GDP grew at an annual average rate of 1.31 per cent over the same period. In other words, the good GDP results of Canadians don’t have a strong foundation reflecting growth in earning potential, sustainable natural stocks, and diversified financial and produced capital.

There’s room for this study to grow in depth and breadth. The Canadian federal government should direct Statistics Canada to regularly report the country’s comprehensive wealth score.

People deserve an accurate sense of how well their economies are performing, with a view to long-term sustainability. GDP has and always will have valuable short-term insights, but to respond to 21st-century pressures we need a modern economic measure. Canada can lead the world as the first nation to adopt comprehensive wealth, making a commitment to the knowledge that empowers meaningful action.

This article first appeared on the World Economic Forum's Agenda on November 13, 2018.

Insight

Making Winnipeg a Smart City With New Technologies

We asked four members of our Winnipeg team how they would tackle some of Winnipeg’s most pressing issues: This is what they came up with.

November 7, 2018

As global populations continue to migrate to cities in search of economic opportunities and higher living standards, the world’s urban centres are continually growing.

However, in a time of limited resources, cities need to actively manage their own sustainable growth. In other words, cities need to get smart.

A smart city is an urban area that uses new technologies and data collection mechanisms to collect information about how the city is working—and then uses it to improve the efficiency of that city’s systems and valuable assets, all in the name of sustainability.

For example, among its many "smart" initiatives, New York City has implemented an internet of things (IoT) system whereby various sources of data, from microwave sensors to traffic video cameras and EZPass readers, are analyzed to alter traffic signals in real time to ease congestion issues in NYC’s busy midtown area and reduce cars’ emissions. Many cities, including Stockholm, London and Singapore have adopted innovative solutions to make their cities more sustainable.

The Peg’s population has grown to 765,800 from 657,800 in the last 10years and is well on course to hitting a million in the next decade.

Winnipeg, in the heart of Canada, is no stranger to fast-growing populations. Thanks mostly to immigration, The Peg’s population has grown to 765,800 from 657,800 in the last 10 years, and is well on course to hitting a million in the next decade.

Nevertheless, Winnipeg still faces a multitude of urban challenges ranging from unreliable public transport to inequitable access to health care. Despite some worthy attempts, Winnipeg also lags behind its Canadian cousins when it comes to implementing smart, city-wide solutions.

To move towards smart city status, however, Winnipeg does not need to reinvent the wheel, given the number of existing smart solutions already out there for cities.

We asked four members of our Winnipeg team how they would tackle some of Winnipeg’s most pressing issues and this is what they came up with.

HEALTH CARE

Jennifer Temmer: Use big data to organize and better target health outreach and education campaigns in libraries.

“In many communities, including those across Winnipeg, libraries have become important public spaces for everything from socializing to accessing the internet. As books and DVDs make way for e-readers and movie streaming services, libraries need to remain relevant.

One unique way to do this would be to take advantage of smart technologies and the power of big data. By connecting library card data with provincial health card data (all of which would be anonymous), community health providers could learn from which health issues library users in certain communities are suffering and then develop targeted approaches for public health education and community interventions on a library-by-library basis.”

ENVIRONMENT

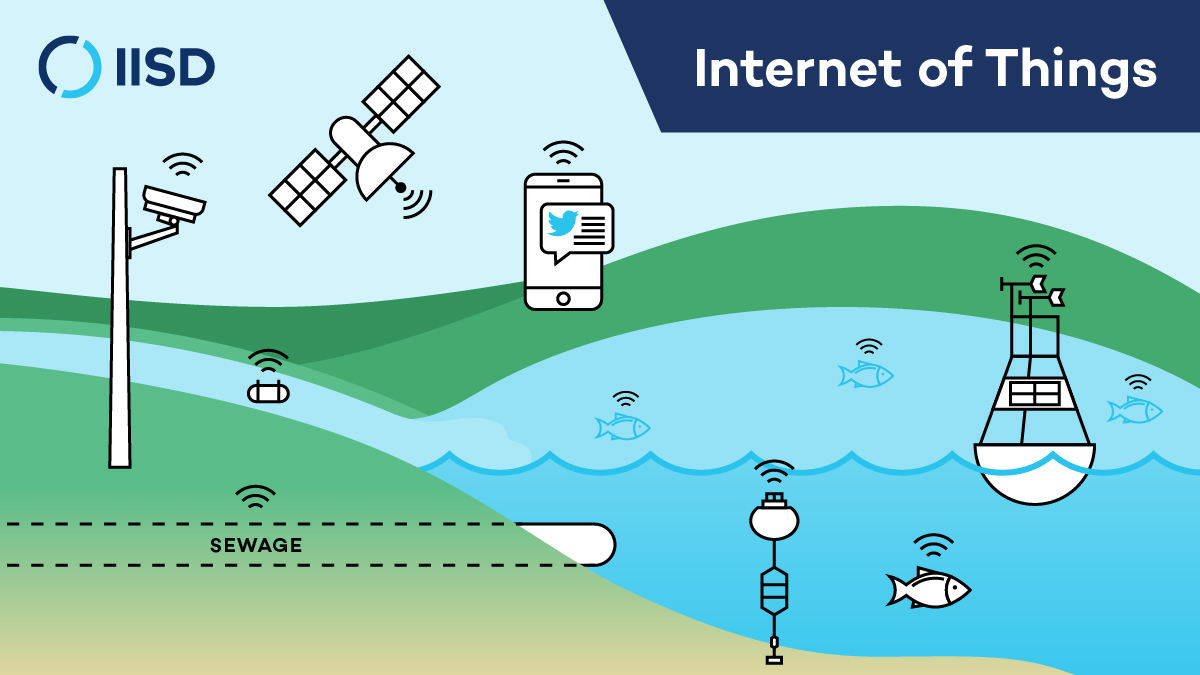
Madeline Stanley: Use sensors and the Internet of Things to detect water quality and sewage spills into Winnipeg’s waterways.

“Manitoba is the land of 100,000 lakes, but here in Winnipeg we continue to release raw sewage into our rivers and lakes. In fact, raw sewage leaks into our waterways daily and we don’t hear about these issues until there is a news flash or extensive harmful algal blooms form on Lake Winnipeg.

When monitoring a lake, the Internet of Things refers to the multitude of sources of data on the health and status of the lake—from photos posted on social media to trackers implanted in fish.

We can learn from the City of Stockholm, which has implemented a source-to-sewer Internet of Things network of sensors to monitor water quality (such as pH, temperature, conductivity, dissolved oxygen) throughout the city’s water system. Data is collected in real time and analyzed with big data analytics to inform and warn city officials about bacterial contamination in drinking water, wastewater release, pollution or algal bloom production so that they can make quick, smart decisions.

To move towards smart city status Winnipeg does not need to reinvent the wheel, given the number of existing smart solutions already out there for cities.

There is a large opportunity for the City of Winnipeg to implement an IoT network throughout our source-to-sewage network. For example, if a sensor detects contamination downstream of a wastewater facility the analytical network could respond by adding chemical treatment or shutting gates to the downstream ecosystem. The integration of these technologies, which are relatively low cost, may resolve some of the largest contributors of point source pollution to downstream ecosystems, such as Lake Winnipeg.”

ENERGY

Geoffrey Gunn: Make buildings smarter to make Winnipeg more energy efficient.

“Although Manitoba’s electric grid is almost entirely powered by renewable hydroelectricity, fully half of our winter energy use still comes from natural gas and fossil fuels. Luckily there are more ways than ever to be smarter about our energy use.

Smart thermostats can now learn how to heat and cool buildings more efficiently and direct heat to the places it’s needed, and in new neighbourhoods we can choose efficient district heating powered by biomass or geothermal systems.

Digital technology empowers networks by linking sensors to controllers with WiFi or cellular technologies. These micro-networks heat rooms, houses and even office buildings more efficiently because they develop more realistic models of airflow and what the needs of users are.

More practically, we can look to innovative projects like the Prince George District Energy System that uses low-carbon biomass to heat multiple buildings across downtown, saving 1,900 tonnes of greenhouse gas emissions each year. This technology used to be more common in industrial facilities, but innovative cities are re-examining it as a way to reduce their carbon footprint and to save money.”

Smart technologies could help Winnipeggers get a better real-time understanding of how long they have to wait for a bus to arrive, so they can plan their trips better, and reduce waiting times, especially in the winter.

TRANSIT

Sumeep Bath: Make Winnipeg Transit more efficient by monitoring usage in real time.

“Despite enjoying a growing population—by an average of 1.7% per year since 2013—Winnipeg’s transit system has been experiencing declines in ridership for the last few years.

While reasons for this decline abound, what is clear is that healthy use of a reliable public transportation system could help Winnipeg to ease traffic congestion issues (and reduce greenhouse gas emissions); allow those with a low income to navigate the city better; and promote tourism.

Smart technologies could help Winnipeggers get a better real-time understanding of how long they have to wait for a bus to arrive, and where their bus is currently located, so they can plan their trips better, and reduce waiting times, especially in the winter.

This can be achieved by placing GPS tracking devices in buses to monitor their actual locations—real-time information that is then accessible via the existing Winnipeg Transit app and informs Google Maps. To improve sophistication, a complement could be using Internet of Things technology to track riders’ cell phone movement to better locate buses, as well as harvesting information from riders’ social media posts regarding transit movements and late arrivals.”